Is your investment generating sufficient returns in relation to the risk that you’re taking? The Sharpe Ratio will tell you the answer
The Shape Ratio is a measure that is widely used in finance to evaluate the performance of a fund or an investment.
The reason the Sharpe Ratio is used instead of a simple return on investment is because the Sharpe Ratio will evaluate the performance of an investment, together with its risk.
Going a little off topic here, the Sharpe Ratio was created by William Sharpe in 1966.
William Sharpe is also famous for introducing CAPM (Capital Asset Pricing Model), which is also a widely used model when performing valuations.
William Sharpe even received a Nobel Prize for his contributions to CAPM.
All these factors have also added credibility to the Sharpe Ratio.
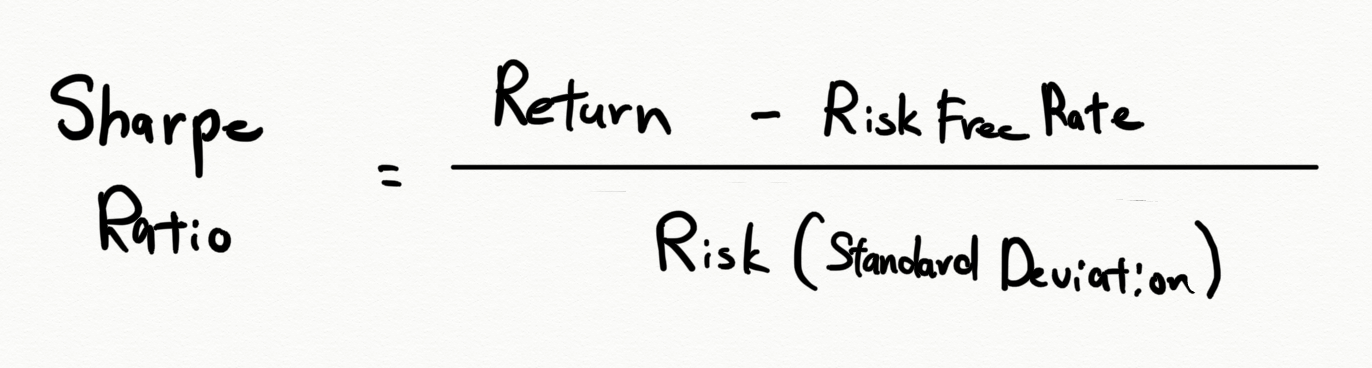
Anyhow, if you look at the equation of the Sharpe Ratio, you will see how risk is being considered in the calculation:

The Sharpe Ratio is calculated as the proportion of excess returns (return – risk free rate) against risk, or in other words, the return that you got for the risk that you took.
You can increase the Sharpe Ratio by:
1 Increasing excess returns
2 Decreasing risk
If risk increases in proportion to the increase in excess returns, you can’t increase the Sharpe Ratio.
Let’s break apart the formula and look into the individual components to better understand the Sharpe Ratio.
Return on Investment and the Risk Free Rate
When evaluating the performance of an investment, the core element is the investment’s return.
The return on investment for a given period is calculated as follows:
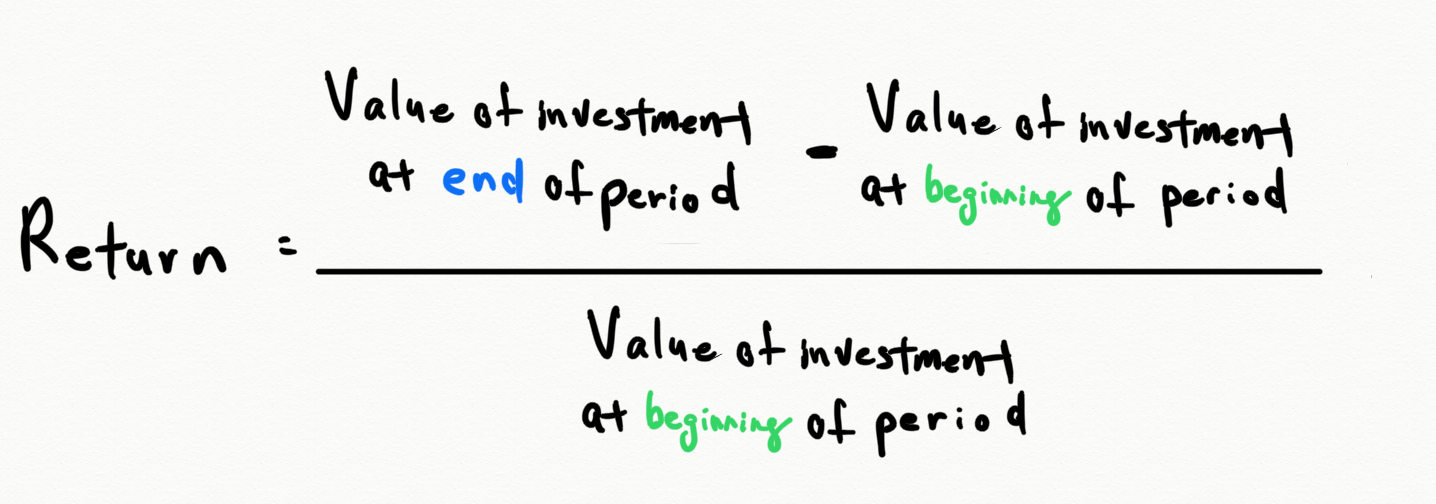
For example, for an investment that is worth 110 at the end of the period, which was worth 100 at the beginning of the period, the return on that investment for that period would be calculated as:
10% = (110-100)/100
The other element in the numerator of the Sharpe Ratio equation is the risk free rate.
While it can be argued that there is no such thing as a risk free asset, and therefore a risk free rate, T-Bill (which are considered to be safe and liquid) rates are generally used as the risk free rate when calculating the Sharpe Ratio for a US investment.
In this example, we will assume that the risk free rate is 1%.
Subtracting the risk free rate from the return gives you the “excess return”.
Going back to the 10% return that was calculated above, you can’t really tell if that 10% was good or not in isolation.
If other investments generated 15% returns during the same period, that would mean that the 10% return was bad, comparatively.
Therefore, it is very important to compare against meaningful benchmarks when evaluating the performance of an investment.
So assuming that you found your appropriate benchmarks, could you evaluate the performance of investments just by looking at their returns?
Let’s say that Investment A cranked in returns of 15%, compared to Investment B which had returns of 10%.
Which is the better investment?
At first glance, Investment A has higher returns so it looks more appealing.
The right answer is, “you can’t tell with just this information”.
Let’s now assume that the price action of Investment A and B during the same period looked something like the following:
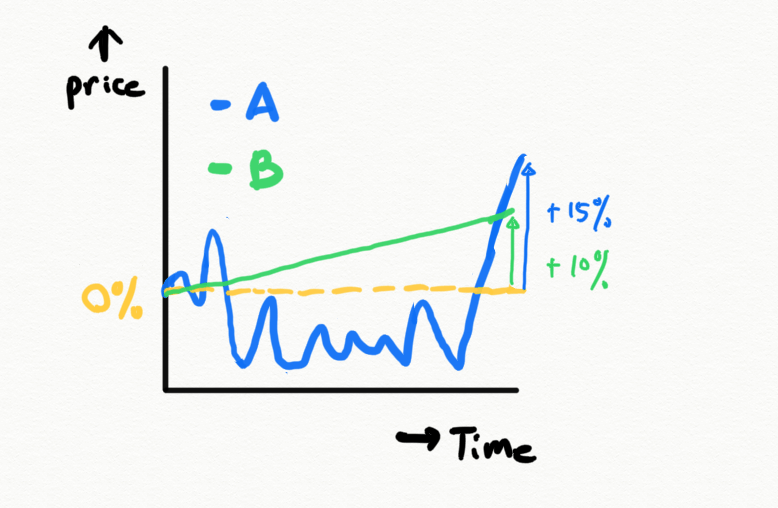
I bet your feelings towards Investment A somewhat changed from when you only knew about the returns.
When you look at the price action, you will notice that Investment A was all over the place with huge swings, while Investment B was relatively stable.
In finance, the variability in returns is referred to as “risk”.
Risk of an Investment
As mentioned above, the variability of returns is referred to as “risk” in finance.
It is also called volatility.
When calculating the Sharpe Ratio, the standard deviation of returns is used as the measure of risk.
Going back to our example, let’s assume that the risk of Investment A was 20% and the risk of Investment B was 5%.
That means that the standard deviations of the returns of Investment A and B were 20% and 5%.
So the variability in returns for Investment A was larger, and therefore the risk was higher.
Let’s now reconstruct the components and calculate the Sharpe Ratios of Investment A and B and determine which was the better performing investment.
Calculating the Sharpe Ratio
The information that you need to calculate the Sharpe Ratios of Investment A and B are as follows:
| Investment A | Investment B | |
| Return | 15% | 10% |
| Risk Free Rate | 1% | 1% |
| Risk | 20% | 5% |
You will get the following results if you plug the information into the Sharpe Ratio equation:
Investment A Sharpe Ratio = (15 – 1) / 20 = 0.7
Investment B Sharpe Ratio = (10 – 1) / 5 = 1.8
Investment B has a higher Sharpe Ratio, meaning that the risk adjusted return of Investment B were better than that of Investment A.
In other words, Investment B had a better bang for the buck.
Wouldn’t you agree that the results are in line with the impression that you got when you looked at this chart?
Calculating the Sharpe Ratio of bitcoin
Bitcoin has been the best performing asset class in the last decade in terms of return.
At the same time, it is considered to be a risky asset because of the huge price swings.
Based on the understanding of the Sharpe Ratio, we can say that what is important is if the returns were sufficient in relation to the risk.
Let’s calculate the Sharpe Ratio of bitcoin and compare it with those of major equity indexes like the Nikkei (Japan) and S&P (US).
Bitcoin started 10 years ago so we’ll calculate the Sharpe Ratios for the Nikkei, S&P, and BTC using daily prices for the past 10 years, 5 years, and 1 year.
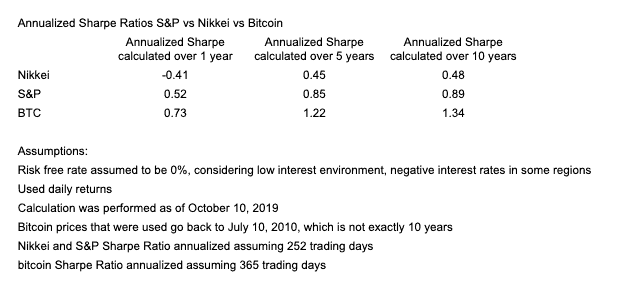
The results are interesting; bitcoin has the highest Sharpe Ratio for all periods.
What we can infer from this result is that the performance of bitcoin was remarkable, even after considering its high risk.
One thing to remember is that the Sharpe Ratio is based on the past performance of the investment and does not give any useful information about the future performance of the investment.
Furthermore, because of the reversion to the mean, one must be cautious after periods of extremely high performance.
Calculating the Sharpe Ratio of Your Favorite Crypto
As we have learned, the Sharpe Ratio is a useful tool to evaluate the performance of investments.
One of the things that make cryptos interesting is that you can easily build your own crypto portfolio.
We thought it would be fun if you could calculate the Sharpe Ratio of your crypto portfolio, just like a fund manager, and compare that with benchmarks.
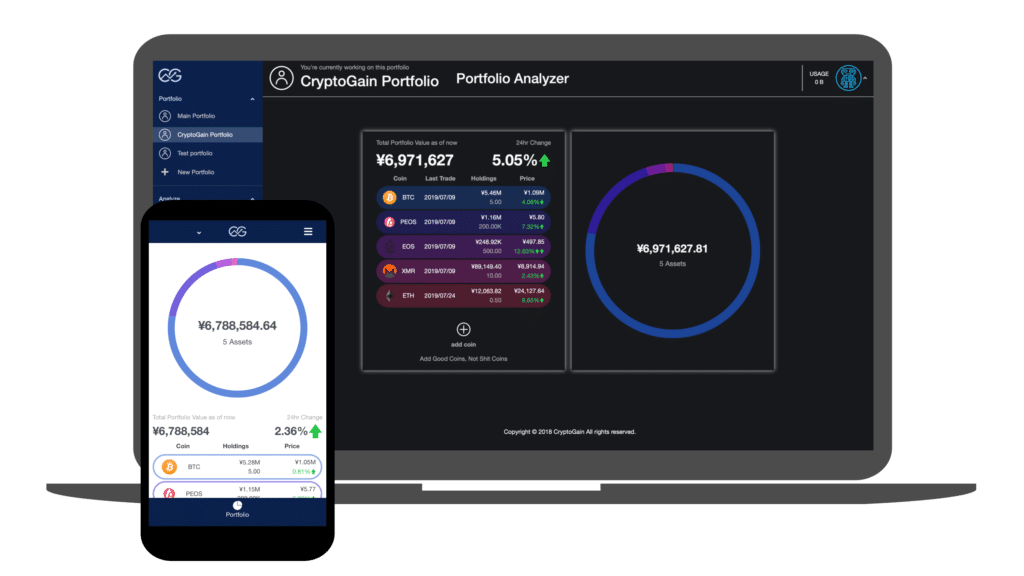
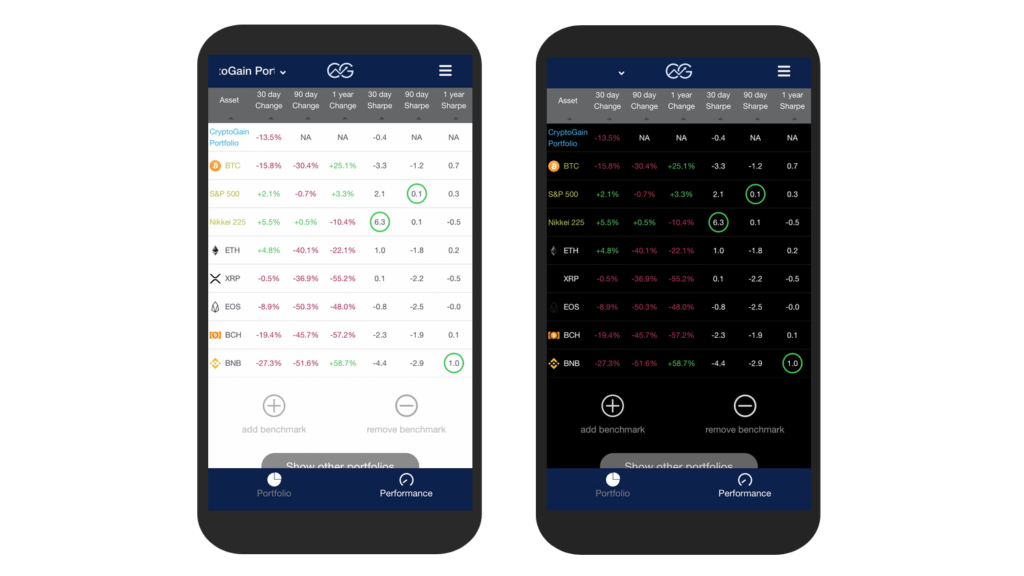
So we added that functionality to CryptoGain.
By using the Performance Analyzer, you can calculate the returns and Sharpe Ratios of the portfolios that you entered.
We’ve preset the Nikkei, S&P, and of course bitcoin as the default benchmarks.
You can also add your favorite crypto as a benchmark!
How to Use CryptoGain
If you haven’t already, you can register to use CryptoGain by accessing the website.
It is free to use and you don’t need to submit any personal information, not even your email!
Website: https://mycryptogain.io