A Bitcoin Pricing Model is getting the industry’s attention
In traditional finance and accounting, many valuation methods and models are used to calculate the fair value of various assets.
The DCF (Discounted Cash Flow) and CAPM (Capital Asset Pricing Model) are some examples that are used to value a business or equity.
These models are used by estimating future cash flows and discounting that to their current values.
At the root is the concept of “future cash flow”.
Assets like gold, silver, and bitcoin, do not by themselves generate cash flows.
Because one can’t estimate the future cash flows of these assets, widely used methods and models in finance can’t be used to value bitcoin.
For the most part, financial institutions haven’t been adding bitcoin to their portfolios, regardless of it being the best performing asset during this decade.
Part of the reason could be that there was no way to reasonably value the asset.
Until perhaps now.
A model that was introduced in an article published to Medium this year has been gathering worldwide attention.
The model that was introduced in the Medium article, ”Modeling Bitcoin’s Value with Scarcity” by the author who goes by the name PlanB, is called the “Stock-to-Flow model”.
Introduction to the Stock-to-Flow Model
The Relationship Between Scarcity and Stock-to-Flow
The introduction to the Stock-to-Flow Model starts by looking at the scarcity of gold and silver.
The scarcity in this context is not referring to the amount of gold or silver existing on this planet.
Rather, it is referring to the size of the stockpile compared with the annual production of the asset.
This idea is also introduced in the book, “The Bitcoin Standard” by Saifedean Ammous, which PlanB says he got his inspiration from when thinking about the model.
So going with the above definition, scarcity can be quantified as SF according to the following equation:
SF = stock / flow
Stock is the existing stockpile.
Flow is the yearly production.
Interesting observations can be made if you apply this equation to several assets that are considered to be scarce.
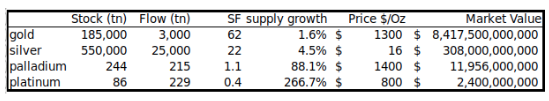
Gold has the highest SF at 62.
SF of 62 means that it will take 62 years to double the amount of the existing stockpile of gold.
The next highest is silver at SF 22.
One can attribute the monetary aspects of gold and silver to the high SF of these assets.
On the other hand, how about assets like palladium and platinum which are actually more limited in amount compared to gold and silver?
The SF of palladium and platinum are 1.1 and 0.4, which are considerably lower than the SF of gold and silver.
It is rare for commodities in general to have a SF above 1.
The circulating supply of bitcoin is currently 18m coins and the annual supply is 0.7m coins, which gives it a SF of 25.
This places bitcoin in the same camp as gold and silver.
Things only get interesting from here.
The annual supply of bitcoin will halven in May of 2020.
The SF at that point will rise to 54 and become closer to that of gold.
In 2024, after bitcoin goes through another halving, the SF will become 115.
At that point, bitcoin will be scarcer than gold and become the scarcest asset in the world.
Recap on how the supply of bitcoin works
Let’s quickly go over how new bitcoins are generated.
The total supply of bitcoin is capped at 21,000,000 bitcoins and no more than that could ever be generated.
New bitcoins are generated (block reward) each time a new block is added to the Bitcoin blockchain.
A new block is generated on average every 10 minutes.
At the inception of Bitcoin in 2009, the block reward started at 50 bitcoins and will continue to halven every 210,000 blocks (approximately every four years).
This is called the halving.
The first halving occurred on November 28, 2012, at which point the block reward of 50 bitcoins per block decreased to 25 bitcoins per block.
The second halving occurred on July 9, 2016, at which point the block reward decreased from 25 bitcoins to 12.5 bitcoins.
The next halving is scheduled to occur in May of 2020, at which point the block reward of 12.5 bitcoins will decrease to 6.25 bitcoins per block.
Bitcoin will continue to go through havlings every four years until the total supply reaches the cap of 21,000,000 bitcoins.
This is expected to occur in the year 2140.
The Relationship Between Stock-to-Flow and Value
Interesting things can be observed if you plot the SF of bitcoin on the x axis and the market cap of bitcoin on the y axis.
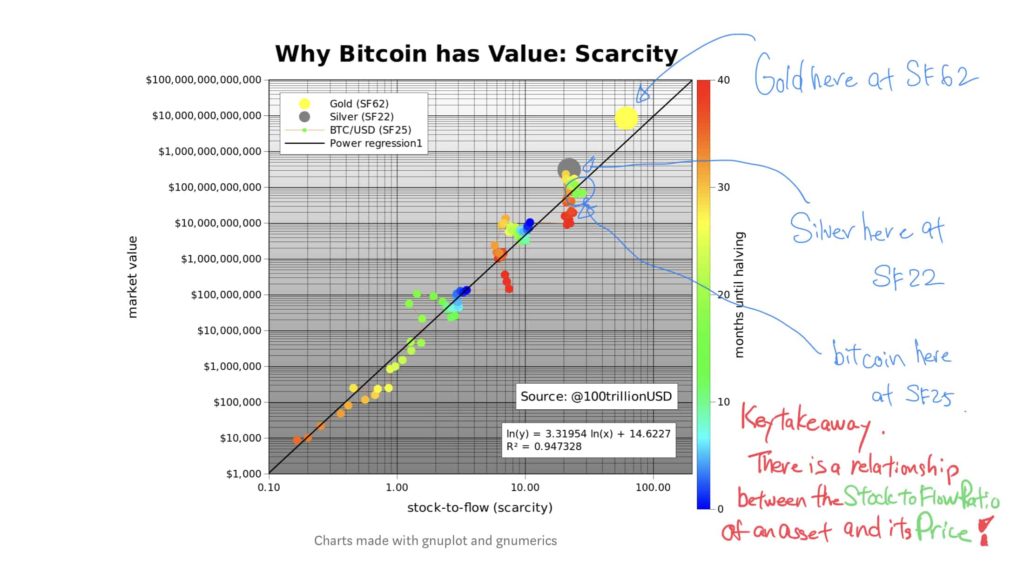
If you draw a trendline that goes through the plotted dots, you will notice that the dots are neatly placed around the trendline.
The R2 of this trendline is 0.95, which means that the relationship between SF and bitcoin market cap is statistically significant.
Expressed differently, 95% of the variability in the bitcoin market cap can be explained by SF.
The amazing thing is that if you plot gold with SF of 62 and silver with SF of 22 into the chart, it appears right along the trendline.
Now that we have more faith in the model, let’s look at the predicted future price of bitcoin using the Stock-to-Flow Model.
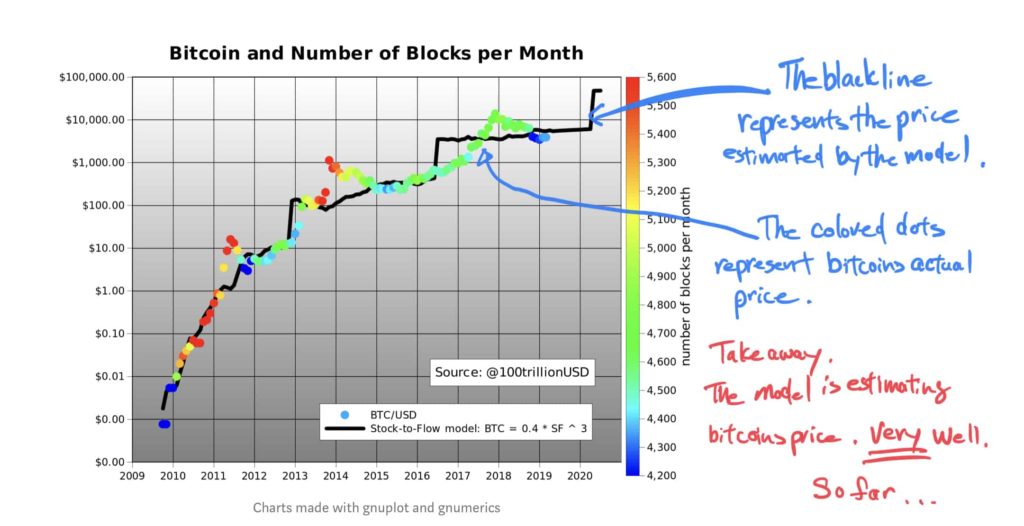
According to the Stock-to-Flow Model, the price of one bitcoin after the May 2020 halving is 55,000 USD.
So What Now
As noted in the beginning of this post, before the Stock-to-Flow Model, there was no widely accepted model to value the price of bitcoin.
The significance of the Stock-to-Flow Model is that we now have a strong candidate to become a model that everyone can agree on.
The most important test for the Stock-to-Flow Model is the halving of 2020 which is approaching fast.
As the world anticipates another bull run in bitcoin prices, the finance world will be watching closely whether the Stock-to-Model will hold.
If the model holds and is able to retain its accuracy, it could be one of the most important discoveries in the area of finance.
It will have its place in finance textbooks, along with CAPM and DCF.
The interesting thing is that as the Stock-to-Flow Model gathers everyone’s attention, the price could converge to the model and lead to a self fulfilling prophecy.
Whether the model holds or not, the finance world is watching closely as we approach the halving of 2020.
Source:
Modeling Bitcoin’s Value with Scarcity – Plan B
https://medium.com/@100trillionUSD/modeling-bitcoins-value-with-scarcity-91fa0fc03e25